AverLAB Documentation
This software manual is in two parts: this section, which covers basic operation of the application, getting started, and creating and using Projects and Tests, and a second section covering AverLAB Automation, Sequences, Limits, Actions, and related topics. This software documentation applies to AverLAB version 2.1.0 and higher.
Below are quick links to all of the various manuals for AverLAB software and hardware:
- AverLAB Software User’s Manual — Basics (this document)
- AverLAB Software User’s Manual — Automation
- AverLAB Quick Start Guide
- AverLAB Hardware User’s Manual
- AverLAB Hardware Specifications
- AverLAB Hardware and Software Limited Warranty
- AverLAB Software End User License Agreement (EULA)
Software Introduction
The AverLAB Audio Analyzer is made up of two main components: the AverLAB hardware device, and the AverLAB software program. Together, these create an advanced, expandable, easy to use audio test system that is perfect for benchtop design and repair, portable in-the-field test, and production test uses. AverLAB software runs equally well on both Apple MacOS and Microsoft Windows 7 and 10 operating systems, with the same features and workflow on both platforms. This manual describes the software features and usage–a separate manual covers the hardware features of the AverLAB system. In addition, a Quick Start guide covers initial setup and first run configuration. Be sure to review that document before starting to use AverLAB.
Getting Started
If you are using AverLAB for the first time, follow the steps in the AverLAB Quick Start Guide to setup your hardware and install the software.
AverLAB’s basic workflow consists of four steps: creating a project, creating one or more tests, running a test, and viewing the results. This section will walk you through these steps so you can get to work with AverLAB. The other sections of this manual provide more detailed documentation for all of the features of the AverLAB software.
AverLAB creates an empty project the first time it runs. To prevent any possible loss of your work, save the project by clicking the Save Project button on the toolbar, or choose Save Project from the File menu. Navigate to where you would like to save the file and give it a descriptive name. The project file will have the extension aver to differentiate it from other file types.
To create a test in the project, click on the New Test button at the top left corner of the project window. A menu of tests will appear. Scroll down and select the desired test type.
A test window opens with available settings for the test. The test is given a default name. To change the name, right-click on the test in the Project window and select Rename from the dropdown list. Enter a new test name and press enter to save the name. Many tests may be configured as single frequency and amplitude tests, or in various swept configurations. Other settings for the test are available in one or more collapsible groups, with settings for input and output channels, hardware configuration, test description, and more.
Most tests require at least one input channel, as well as zero or more output (generator) channels. Some selections will disable other incompatible options. When disabled, these settings and channels will appear in gray and will not respond to clicks. For example, selecting the AES A input will disable the other digital inputs–other than AES B–since only one digital format may be selected at a time.
To run a test, open the test by double-clicking on the test name in the Project window. In the test window click the Run button to run the test once, or click Loop to run the test continuously. Another window will appear with the results of the test. Some tests–especially swept measurements–may take some time to complete. The results window will display the data in real-time as it updates to show you measurement progress.
Creating Projects
To create a new project, choose New Project from the File menu or click the Create New Project icon in the main toolbar. A dialog box will ask to save the file if there are any unsaved changes to the current project. A new, empty project will appear, and all settings will be set to default values.
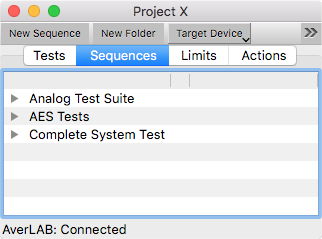
The Project Window
Everything associated with a project is included in the Project Window. Along the top are two rows of buttons and tabs: the lower row is a series of tabs that provide different views of project-specific items: Tests, Sequences, Limits, and Actions. Above the tabs are buttons that perform system actions common to all projects, such as selecting a particular AverLAB hardware device, or that are related to the tabs themselves, such as creating new tests or new sequences.
At the bottom of the Project window is a status bar that shows the name of the current AverLAB hardware device and it’s status: Connected, Offline, Running, and Unavailable.
Connected means the device is ready for use.
Offline means the device is not available; it is either not on the network, not turned on, or is in use by someone else.

Running means the hardware is busy running a test or updating settings.
Unavailable means the hardware returned an error or timed out on the network. Power cycle the unit and restart the software to reset this error condition.
Test Tab
The Test tab shows the currently defined tests in the project. To run a test, double-click on the test in the list to open the Test window, then click the Run button in that window. Alternatively, right-click on the test (Ctrl-click on the Mac) in the Project window to open the context menu and select Run. In either case, a Test window will open, and after the test is complete a Result window will appear. This context menu also has selections for looping, deleting, renaming, opening, and other related test functions.
The triangle icon on the left expands the test settings so they can be viewed or edited directly in the Project window. Double-clicking on the test will open it in a separate window. Multiple tests can be open at once. Results of past tests are found in the Results group at the bottom of the expanded test group. Expanding the Results group and double-clicking on any of the listed results will open the corresponding result in a window.
New tests are defined by clicking on the New Test button in the Project window, and selecting the desired test type from the drop-down menu. The new test will appear at the bottom of the list in the Test tab. To reorder tests in the list, click and hold on the test and drag it to the desired location in the list.
Clicking on the New Folder button will create a new folder in the project. Drag tests into the folder to organize tests, and rename the folder by right-clicking and selecting Rename Folder.
Sequences Tab
A Sequence is a series of tests and/or Actions that are executed as a group. These are ideal for executing commonly-used tests during development and in production. An entire, complex production test for a product can be created by defining tests and limits, then dragging them into a Sequence. Actions can then be used to do things such as give operator instructions during execution of the sequence.
To create a sequence, click on the Sequence tab, then click on the New Sequence button. A new sequence will be added to the list with a default name and an empty sequence window will open. Rename the sequence by right-clicking on the name and chose Rename from the context menu.
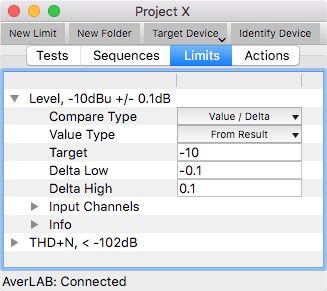
Limits Tab
Limits are simple comparisons that can be applied to the results of tests. Basic limits are currently implemented: Less Than, Greater Than, Range (Min/Max), and Range (Value/Delta). Selecting the Compare Type will change the settings that are shown. Different Value Types may be chosen, including level, gain, percentage, and more. By default, the value used in the compare is the same as the Default View selected in the test itself (“From Result”). Since Limits are a numerical comparison, no units need be specified–the units used are the same as those returned from the test result.
Any number of limits may be created and assigned to any number of tests in a sequence. Simply click on the New Limit button to create a new limit, adjust it’s settings, and drag it from the Limits window onto a test in a Sequence window. To rename the limit, Right-click on it–either in the Limits window or in the expanded list under the test in the Sequence window–and choose Rename. Expand the Input Channels group in the limit and select the channels to which this limit will apply. Tests can have multiple limits, with different values and channels, making it easy to handle results that are different across various channels. For example, the main outputs for a device may be different levels and performance from the headphone outputs, and this is easily handled by using multiple limits. And since AverLAB tests all channels simultaneously, applying multiple limits speeds up the test process.
Actions Tab
Actions are pre-defined, commonly used functions that can be inserted in a sequence. To use Actions in a sequence, drag the action into the Steps group in the Sequence window. Expand the action using the group triangle to see and change the available settings for the action.

New Folder Button
The New Folder button appears at the top of the Project window when the Tests, Sequences, or Limits tabs are selected. Folders provide a convenient way to organize items, just like folders on your computer. Create a new folder by clicking on the button. The folder can be renamed by right-clicking and selecting Rename from the context menu. Drag items into the folder, and drag folders in the tab window to rearrange. Note that folders in a tab can only contain items of the same type, or other folders. That is, folders in the Test tab can only contain tests or other folders of tests, while folders in the Sequences tab can only contain sequences or folders of sequences, and so on. As always, clicking on the group triangle will expand the folder to reveal the items within.
Target Device Button
Clicking on this button displays a list of all AverLAB devices that are available or that have been available in the past. Devices that are currently available show a blue square icon in front of the name, while devices that have been seen in the past but are not currently available show a yellow triangle icon. Choosing a device that is not currently available will show Offline status and when the device becomes available again the program will automatically connect.
A special device called AverLAB DemoMode always appears in the list. This device may be selected at any time to allow project and test creation and editing without requiring AverLAB hardware.
Identify Device Button
Clicking on this button will cause the three function buttons, FN1, FN2, and FN3 to flash rapidly on the currently connected device. This helps to identify which AverLAB is in use, and is especially useful in environments with multiple AverLAB’s on the same network.
Defining and Editing Tests
After creating a test using the New Test button, a Test window opens. This window contains the settings needed to execute that particular type of test. The exact combination of settings and parameters may vary depending on the type of test, and on certain settings in a given test.
All tests have several groups of settings: Info, Hardware Settings, Advanced Settings, Input Channels, Output Channels, and Results. In addition, the most common settings for the test appear at the top of the list, along with the test Type, which is not editable. More information about the settings, behavior, and algorithms used in these tests can be found in the Tests and Algorithms section below.
Info
The info group shows the date and time the test was created and last modified, along with a text field for a description. These values make it easier to tell different tests apart, even if the settings and names are similar. The description field is especially useful to document how the test is to be used and any special cases and instructions may be required. Tests, limits, and sequences in AverLAB all provide a similar Info group for this purpose.
Hardware Settings
Settings relating to the AverLAB hardware are stored in the Hardware Settings group. These include:
Analog Bandwidth
This setting sets the bandwidth for any analog input channels used in the test. Available settings are: 22000, 44000, and 88000, corresponding to an approximate system bandwidth of 22kHz, 44kHz, and 88kHz. Both analog channels have the same bandwidth.
Analog Range
AverLAB’s analog input channels have stepped gain instrumentation amplifiers to maximize performance. Normally, the system will autorange to find the best possible range for a measurement. This is a quick process, but does take some time. If the measurement range is known, set the amplifier gain to a particular range to eliminate the time spent finding the proper range. Use this drop-down menu to select Auto, or one of the available fixed ranges. The range values shown depend on the units selected in the Analog Amplitude (generator) field.
Digital Sample Rate
This setting sets the sample rate for any digital input channels used in the test. Available settings are: 44100, 48000, 88200, 96000, 176400, and 192000, where those values are in Hz. The default setting is 48000 Hz.
Digital Sync
This sets the sync source for digital audio. Possible sync sources are: Internal, External, AES, Optical, S/PDIF, and ADAT. Note that in all cases the digital generator and digital analyzer use the same clock domain, and thus the same sync source. The analog generator and analyzer use a separate clock, unrelated to the digital clock, whose frequency is set based on the analog bandwidth selected for a particular test.
Internal uses AverLAB’s internal crystal oscillator as the sync source.
External uses the Word Clock input on the rear panel of AverLAB. Connect the appropriate word clock signal to this BNC input.
AES, Optical, S/PDIF, ADAT use the corresponding input signal as the sync source. This requires that the device under test be the clock master. As a result, looping back AverLAB’s generator output, or attempting to use AverLAB’s Word Clock output to drive the device under test will not provide proper sync. In this case, the LOCK LED on the front panel will light red and all results will be as if there is no input signal.
Digital Wordlength
Sets the word length for digital generator data output from AverLAB. Possible settings are: 24, and 16 (bit). Most tests should use the 24-bit setting since this gives the best performance and matches the capabilities of most modern digital audio devices. Use the 16-bit setting for tests such as DAC muting, or for lower resolution consumer audio devices.
Digital Dither
Sets the type of dither used for the digital generator. Available settings are: None, Rectangular, and Triangular. Most tests should use None, since the generator is 24-bit resolution, with no truncation.
Dither is random noise that is added to the digital signal, and affects the lowest bit of the data. In cases where word length is truncated, dither may allow signals to be heard or measured below the expected level for the number of active bits, but at the cost of slightly higher noise floor. The type of dither refers to the shape of the Probability Density Function that defines the dither. For Rectangular, the dither is distributed uniformly; any value is possible for each sample. Triangular has a shape that is maximum at one point and decreases linearly as it moves away from the center. In many cases, Triangular dither provides the best performance, minimizing noise modulation and distortion caused by the addition of dither.
Advanced Settings
Certain advanced settings are available in the Advanced Settings group. These settings are not commonly used, but may improve performance in some situations.
Setup Delay
This provides a delay, measured in milliseconds (ms), from the start of the test until measurement begins. If at least one output channel is specified–meaning that the built-in generator is being used–the generator is turned on at the beginning of the test and the system waits for Setup Delay time before starting the first measurement. Setting this to a non-zero value will give extra settling time for devices that are sensitive to input level changes, or that need to do internal processing that takes time, such as locking phase-locked loops. Increasing this time may also improve measurement performance for certain swept tests. This delay only happens once at the beginning of test execution.
Sweep Step Delay
This delay occurs immediately before each measurement step (point) in a swept measurement. In this case, the generator frequency or amplitude is changed, then the Sweep Step Delay time elapses before the next measurement is made.
Loop Delay
This delay applies if the test is running as a loop, and occurs immediately after the last measurement in each cycle of the loop. This is similar to the Setup Delay, except that it occurs on every cycle through the loop.
Input Channels
The Input Channel group allows the selection of Input (analyzer) channels for the test. Check the desired channels to select them. Once a channel is selected, some other channels may become unavailable with their checkboxes greyed out.
For example, selecting Analog Balanced A for the input will disable Analog Unbalanced A, since that input is not available when the balanced input is in use for that channel. Likewise, only one digital format may be used at a time. If one of the ADAT channels is selected, for example, all of the other digital formats is unavailable. However, all the ADAT inputs and outputs are available and may still be selected.
Both analog and digital channels may be selected for the same test. AverLAB will test both domains simultaneously, and the results will be combined in the result window.
Output Channels
The Output Channels group is similar in function to the Input Channels group. If a channel is selected, a high-performance signal generator is connected to the specified output channel. Both analog and digital channels may be selected for the same test, but only one digital format can be used at one time.
Results
The results of a test are kept in the Results group inside that test. By default, there are two folders in the Results group: Scratch and Saved.
When a test runs, the results are automatically stored in the Scratch folder. Normally, the contents of this folder remain in the project. However, this behavior can be changed by checking Delete Scratch result folder contents on project save in the Project Preferences dialog.
Results can be permanently saved in the project by dragging them from the Scratch folder into the Saved folder. Results may also be organized into different folders. To do this, right-click on Results and choose New Folder. The folder or a result can be renamed by right-clicking on it and choosing Rename. Drag results into the new folder, or between folders as desired to organize your results. Folders may contain both results and other folders with results, as needed. Folders and their contents may also be deleted using the right-click context menu options.
Note that the Scratch and Saved folders cannot be renamed or deleted, even though the right-click menu appears to allow the operation. However, the contents of these folders, or any other folder in the Result group can be immediately deleted by choosing Delete Contents from the context menu. Use Undo to restore any accidentally deleted results or folders.
AverLAB displays results in a separate window, one for each different kind of test. Some tests are single valued, such as single point level, THD+N, SNR, etc. These results display in a window that displays the results as text.
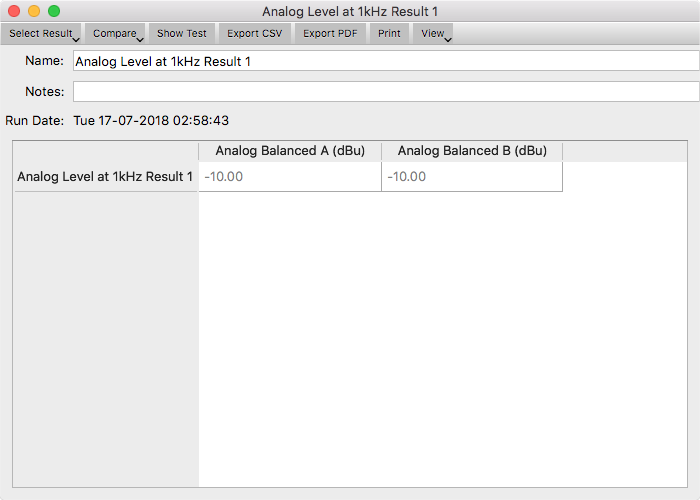
Click to see full size
Tests such as FFT, level vs. frequency, THD+N vs. level, etc. are automatically displayed as graphs.
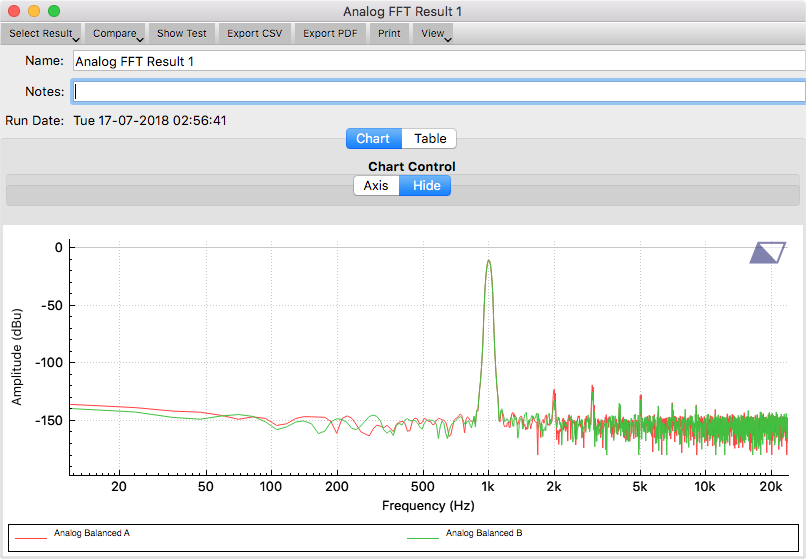
Click to see full size
Viewing Results
The Result window appears when a test is run. To view results from a previous run, expand the test in the Project window, then expand the Results group and double-click on the result to view. The Result window will open to show the selected saved or scratch result.
If the Test dialog is already open, click on the Select Result button to show a menu of available results. If there are multiple results available–for example after several runs of the same test, scroll down the list to select the desired result.
To resize a graph, use the mouse to grab the graph itself or either axis and drag to move the plot in the graph area. To zoom the graph, use the mouse wheel or mouse gesture to resize the plot on the graph. Ctrl-click or right click to open a context menu and select Auto to resize the plot to the default size.
To change the graph’s X and Y axis, click on the Axis tab under Chart Control. The window expands to show separate axis settings for the X-axis on the left and right of the graph, as well as Y-axis settings. The separate left and right X-axis scales are useful when both analog and digital measurements are shown on the same graph. Click on the Hide tab to hide the Chart Control settings and expand the graph to maximum size.
To view the individual data points for a graph, click on the Table tab near the top of the graph. Some graphs may have too much data to display as a table, and in that case the Table list may be incomplete. Table data can be saved as a CSV format file by clicking on the Export CSV button at the top of the window. All data will appear in the CSV file, regardless of the number of points.
Exporting Results
Click the Export CSV button at the top of the Results window to save the results as a CSV format file. A Save dialog will open. Navigate to where you want to save the file, give it a name, and click Save.
To save a graph as a PDF, click on the Export PDF button at the top of the Results window. A Save dialog will open. Navigate to where you want to save the file, give it a name, and click Save.
Comparing Results
Any combination of the results from a particular test may be compared to each other, and the selection for comparison can be changed at any time. This can be used to see trends in test results or compare one device under test to another. To compare runs, click on the Compare button in the result window and select two or more results from the list. To deselect a result, select it again from the list to uncheck it.
Printing Results
To print results, view the results in the results window, click on the window to make it the focus, and choose Print… from the File menu. A Print Preview window will open, allowing selection of page orientation, page setup, and other parameters. Clicking on the Printer icon opens a Print dialog where the printer may be selected. Clicking Ok will send the page, as shown, to the printer.
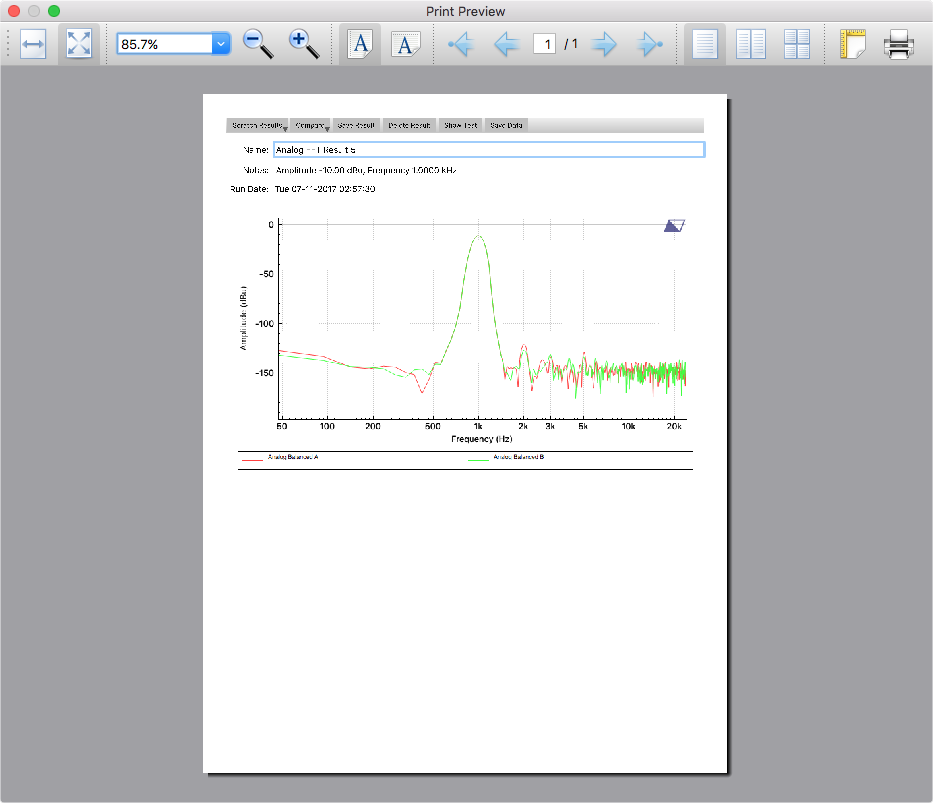
Click to see full size
Using Cursors
When displaying graphs, the results window shows cursors for each channel any time the mouse pointer is over the window. Click on the result window to give it the focus, then move the mouse over the graph. Cursors will appear and track the mouse. A readout appears in the upper left corner to show the current values of the graph for each channel shown, the current x-axis value, and the value corresponding to the location of the mouse pointer on the graph.
View Menu
Click on the View menu button to display a list of different available views of the result graph. The same measurement data can be viewed as Level, Gain, Reference, or dBc.
Level
This is the most common selection and displays the actual measured level values. For example, if the measured input level at 1 kHz is -10 dBu, the graph will show a -10 dBu level at the 1 kHz Y-axis point.
Gain
The Gain view shows the difference between the generator level and the measured input level at each point of the graph. Thus, if values are greater than zero then the device being tested has gain, and if values are less than zero the device has loss, relative to the generator level.
Reference
Results may be viewed relative to a fixed reference level by using the Reference view. To use this feature, set the reference level for each channel in the Channel Preferences dialog. Then select Reference for the view to see the measurement relative to the specified reference level.
dBc
The dBc view auto adjusts the graph so that the highest level is always shown at the top of the X-axis as a zero level. All other values of the graph are displayed relative to that zero peak. This is especially useful for FFT measurements, since it is easy to measure the level of harmonics and other signals relative to the carrier peak, regardless of the signal level.
Front Panel Controls
AverLAB’s front panel encoder and buttons allow direct control of the software’s basic functionality without the need for a mouse and keyboard. This is especially useful on a crowded bench, where space is at a premium.
Controlling AverLAB software using these controls is easy. With a test currently open, press and hold FN1 until it lights up. The knob can be used to select any of the fields on the test dialog–the background of each field will turn grey as the knob is turned. Press FN1 again to select the currently highlighted field, which then turns green. Turning the knob in that state will change the value in the field. The adjustment is immediate, so tests that are looping will be affected in real-time. To exit this adjustment mode, press and hold FN1 until it is no longer lit.
FN3 may be used at any time to trigger the current test to run. Double-clicking FN3 will loop the test. Looping can be stopped by double-clicking FN3 again.
Main Toolbar
AverLAB has a main toolbar that is always visible. These icons are, from left to right, Create New Project, Open Existing Project, Save Project, Close Project, Print Current Window, Show All Windows, and Close All Non-Project Windows. As an easy reminder, hovering the mouse pointer above any of these icons will display tooltips showing the function of the button. The toolbar may be repositioned on the screen or moved to other displays, as desired.
![]()
Preferences
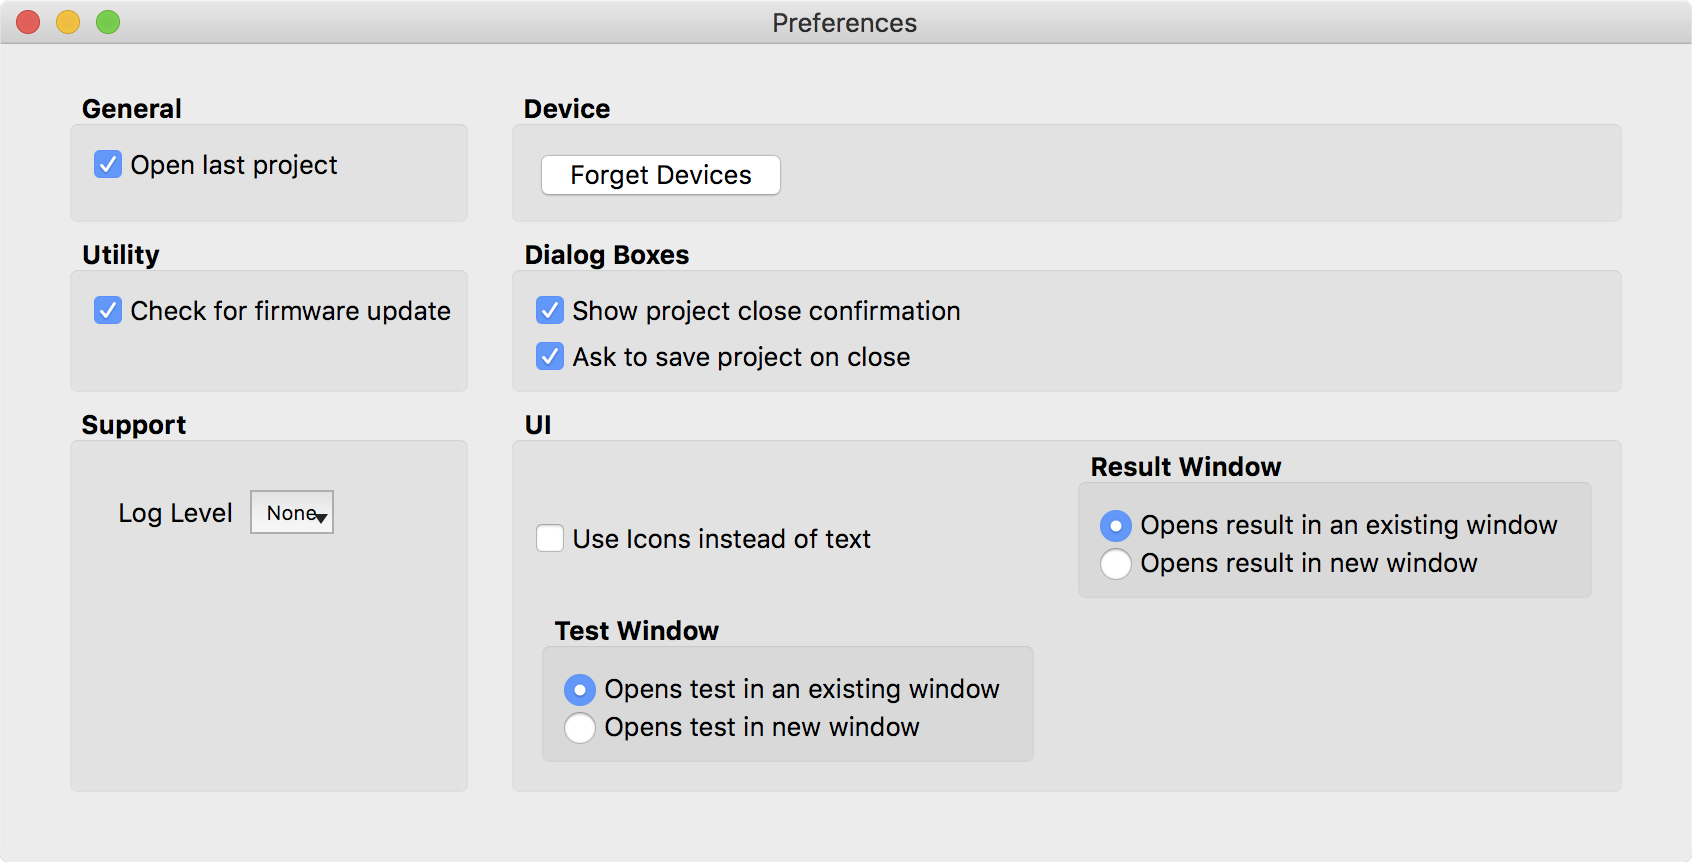
Application Preferences
To open the Preference settings for the AverLAB software, select Preferences… from the AverLAB menu (on MacOS) or from the Edit menu (on Windows). These preferences are global and apply across all projects. There is no save button on this window–settings are automatically saved as soon as they are made.
Open last project
If checked, AverLAB will open the last project that was in use when the application was closed. If unchecked, the program will open with a new, empty project.
Save open window list
If checked, all windows that were open when the program was last closed will be reopened when run again. Unchecking this option will open the project window when a new project is loaded, but will not automatically open any other windows or dialogs.
Save scratch results
If checked, scratch results–any result from a test that has not been explicitly saved–will be automatically saved in the project file. This ensures that no results are accidentally lost when closing a project. However, the project file size will grow as more scratch results are added. Unchecking this option will delete any scratch results that were previously saved in a project, and will not save scratch results with future save operations.
Click to see full size
Forget Devices
Clicking this button will clear the Target Device menu. This will remove any devices that the program has seen in the past, and only devices that are currently available will appear.
Check for firmware update
This should normally be checked, except as directed by Avermetrics technical support. Each version of the application expects a specific version of firmware for compatibility, and unchecking this option may cause the versions to become out of sync with future updates. This could result in unexpected operation or erroneous results.
Show project close confirmation
When checked, AverLAB will ask to confirm closing the project. Unchecking this option will allow the application to close the project without confirmation.
Ask to save project on close
If there have been any changes to the project since it was last saved, checking this option will cause AverLAB to ask for confirmation to save the changes before closing the program. When unchecked, any changes are automatically, silently saved on exit.
Use Icons instead of text
Some buttons are available as either text or as icons. Check or uncheck this option and restart the application to change the state of these buttons.
Project Preferences
The Project Preferences dialog, located in the Project menu, provides a way to set various project-specific settings. Available settings are organized in three categories.
Analyzer Default
One setting is available here: the default Units to be used when creating new tests. For example, selecting dBu means that the default units used for new tests will be dBu, while selecting dBV means that new tests will use units of dBV. The units used in any field in a test can be changed at any time by typing the desired units when entering values.
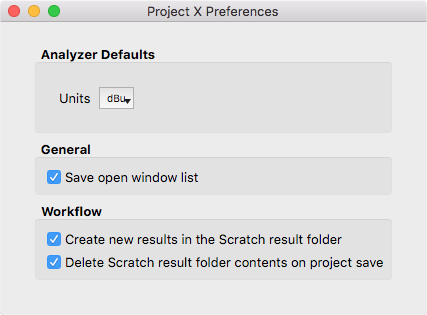
General
One checkbox is available here: Save open window list. When checked, the current configuration of open test and result windows will be saved and reopened when the project is opened again in the future. Note that only the open window list is saved; the location and size of those windows is still determined at run time.
Workflow
Two checkboxes are available, both related to the handling of results. Create new results in the Scratch result folder, when selected, automatically stores new results in the test’s Scratch folder. If unchecked, results are added at the bottom of the Results folder instead. They may later be dragged into any folder available in the Results group.
Delete Scratch result folder contents on project save, when checked, will automatically delete all of the results stored in the Scratch folder the next time the project is saved. This is useful in some workflows where only a small number of test results are useful after a large number of runs. In this scenario, drag the results you wish to keep out of the Scratch folder into another folder, then save the project. The extraneous scratch results will be discarded, and the desired results will be saved in the project.
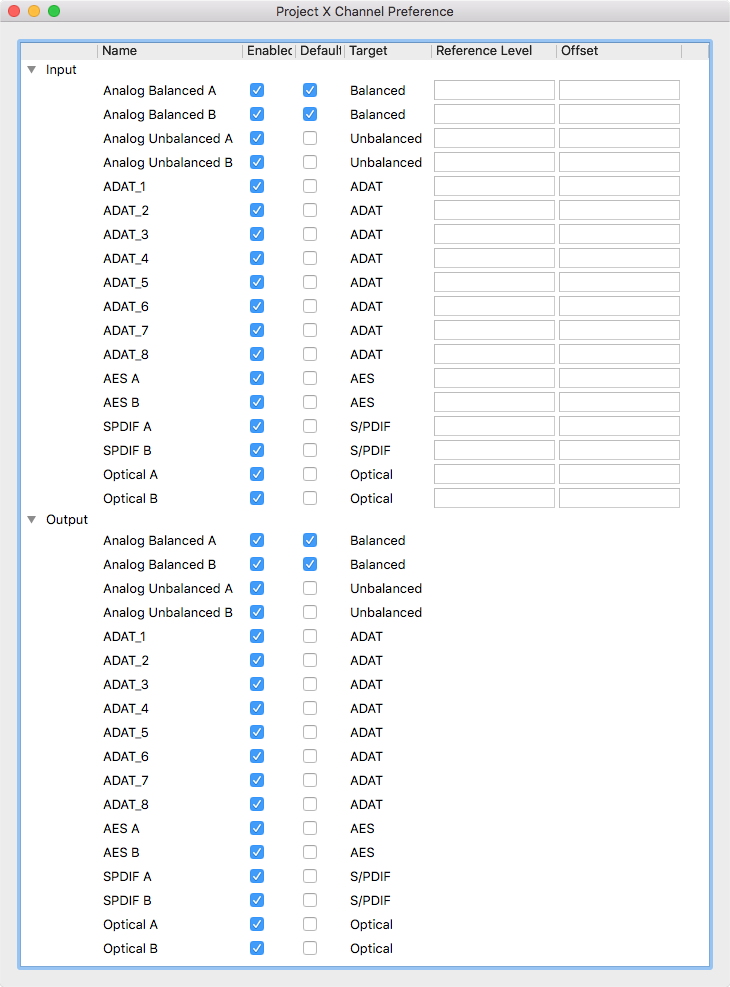
Channel Preferences
The Channel Preferences dialog provides a convenient means to customize the I/O configuration that is presented in test windows. Channels can be given friendly names that indicate what is connected to AverLAB, such as Main Out Left and Main Out Right. You can also hide channels that are not used in the project to simplify workflow.
To edit the name of a channel, double-click on the name to make the field editable, then type in a new name. Each channel has a Default checkbox. Any channels marked as Default will be automatically selected as active channels when you create a new test.
Reference Level
Normally, measurements are absolute, meaning the result is not in reference to another measurement or value. To make a measurement that is relative to a reference level, enter the reference level for each channel in the corresponding Reference field. For analog channels, Reference Level, use units of dBu, dBV, dBuV, V, mV, or uV. For digital channels, use the unit dBFS. Measurements are absolute if the Reference field for that channel is empty.
Offset
Sometimes it is desirable to make measurements with attenuators or preamplifiers connected to the analyzer inputs. For example, when testing high-power amplifiers the measured voltage may exceed the maximum input level of the analyzer. To prevent overload, insert an attenuator at the analyzer input and enter the attenuation as a negative number (in dB) in the Offset field for that channel. The reported value will be corrected by this offset, and the measurement value will be as expected.
Offset is always in dB, and the dB unit is required when entering values in the field. This value is subtracted from the measurement to get the corrected value. A negative offset (for attenuation) is thus added to the measurement, correcting for the attenuation. Likewise, a positive value (for amplification) is subtracted from the measurement, correcting for the additional gain at the analyzer input. Leave the field empty to disable the offset feature for that channel.
Click to see full size
Device Configuration
The Device Configuration dialog in the Device menu, and provides features to rename the AverLAB hardware, change it’s IP address, view the state of the device, and if the device needs firmware update, initiate that process.
System Name
The System Name is useful for users to identify one AverLAB on a network from another one. The default setting is AverLAB, and in cases where it is the only one on the network (or if AverLAB is connected directly to the host computer), this name is clear. But in a larger engineering or production test environment there may be multiple AverLAB’s present, and it can be confusing if they all have the same name. The software uses the device’s MAC address for identifying each device; these are globally unique, so the software will never be confused by two devices with the same name. But giving each unit a different name can help users select the proper one.
To change the system name, change the name in the field and click Apply. Follow the prompts to ensure the proper device is being renamed and complete the operation.
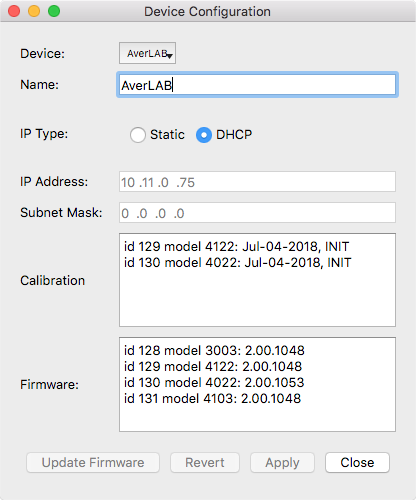
IP Address
AverLAB can use Dynamic IP (DHCP) or Static IP to set the device’s Ethernet address. Most systems use DHCP, since this is the easiest to use and administer. However, turning DHCP off and setting a static IP address may speed up the connection process between AverLAB and the host computer. This is especially true when connecting the unit directly to a host, without an associated network.
To change this setting, click on the group button for Static. Then enter a valid IP Address and Subnet Mask, then click Apply. Follow the prompts to ensure the proper device is being set and complete the operation. Selecting DHCP is easy as well: click on the DHCP group button and click Apply. The IP Address and Subnet Mask are ignored when using DHCP.
For Static IP, select an IP address that is in the subnet for your existing network. For example, if your local network uses 192.169.0 as its subnet, choose an unused address in the range of 192.168.0.1 to 192.168.0.254. For such a subnet, the Subnet Mask would be 255.255.255.0, indicating that only the lowest octet is available in the subnet for devices. Note that it is possible to set an IP address that cannot be “seen” in a given network. As an example, for the subnet above, setting the address to 192.168.1.1 would put the device on a different subnet, and the host computer would not be able to find the device. In this case, reset the device settings back to factory default as shown in the AverLAB Hardware User’s Manual.
Calibration Info
These entries show the last calibration date, and the initials of the test technician that performed the calibration. Units that are initially calibrated by Avermetrics show the operator name as INIT. Only the analog generator and analyzer in AverLAB require calibration.
Firmware Version
The AverLAB hardware consists of four logical modules, each with its own firmware. The version currently running on these modules is shown here. Note that the firmware must match that required by the AverLAB software. If any firmware version does not match, on startup the program will ask to update the unit with the proper version. Using AverLAB with non-matching firmware may give incorrect results or cause the hardware or software to crash, and is not recommended.
Tests and Algorithms
AverLAB supports a wide variety of tests, and more are being added to the program with each release. Most tests can be run as single frequency tests or as swept tests vs. amplitude, frequency, or other parameters. Common parameters of the tests below are documented in the Defining and Editing Tests section above. Settings that are unique to each particular test type are documented here. This section also discusses the algorithms used in the implementation of these tests.
Entering Values and Units
Most fields require units as part of the entered values. For example, level entries require a unit to fully specify the level; -10 isn’t a valid level, but -10 dBu is. Thus, in this case the dBu unit is required when entering such a level.
Valid level units are: dBu, dBV, dBmv, dBuv, V, mV, uV, and dBFS (for digital levels). dBFS is only valid for digital levels, and is the only unit that is appropriate for those entries. Frequency can be specified as Hz or kHz.
The fields remember the last unit entered, so it is valid to enter a new numeric value without units, since the field will autopopulate with the previous unit. For example, if a level field previously held 26 dBu, typing 4 and pressing enter will autopopulate the field with 4 dBu. The background of the field will turn yellow if the value being entered is incomplete or out of range. The field background will turn red if the current value is invalid, for example if an invalid unit is entered such as dB instead of dBu or dBV. Simply correct the entry and press enter to update the field.
Common Settings
Sweep Type
Most tests have a drop-down menu for Sweep Fixed (single-frequency), Sweep Frequency, and Sweep Amplitude. Changing this setting will also change which other settings are available for the test. Frequency, Analog Amplitude, and Digital Amplitude fields are available. Since both digital and analog measurements can be done at the same time, there are separate fields for the digital and analog generator level and units.
Generator/Analyzer Measurement Units
The units specified in the Analog Amplitude and Digital Amplitude fields are also used as the units reported in the analyzer (input) measurements, regardless of whether a generator is used or not. Uncheck all of the Output Channels if no generator is required–the Frequency field should still be set to the nominal frequency of the incoming signal for best measurement accuracy, even if the generator is not used.
Generator
If one or more Output Channels is specified, clicking on the Generator button in the row at the top of the test window will turn on the generator when no test is being run. If more than one Test window is open, clicking on each window will switch AverLAB to the generator, Hardware settings, and other test configuration settings that apply for that test. Thus, clicking between two tests with different settings will cause the AverLAB hardware to “adopt” those settings while that window has the focus.
Default View
Click on the View menu button to display a list of different available views of the result graph. The same measurement data can be viewed as Level, Gain, Reference, or dBc.
Level
This is the most common selection and displays the actual measured level values. For example, if the measured input level is -10 dBu, the result will show a -10 dBu level.
Gain
The Gain view shows the difference between the generator level and the measured input level. Thus, if the value is greater than zero then the device being tested has gain, and values less than zero indicate the device has loss, relative to the generator level.
Reference
Measurements may be made relative to a fixed reference level by using the Reference default view. To use this feature, set the reference level for each measurement channel in the Channel Preferences dialog, found in the application’s Project menu. Reference levels must be in dB-related units (dBu, dBV, dBmv, dBuv), but do not have to be the same units used for the measurement itself–the software will convert to the proper units when needed. For example, if the device under test’s nominal output level is +4 dBu, setting the Reference Level to +4 dBu gives results relative to this nominal level. Thus, it is easy to see that results that are negative (e.g., -6 dB) are below the +4 dBu reference level, and positive values are above the reference level.
dBc
The dBc view is available for chart results. In this case, the chart auto adjusts the graph so that the highest level is always shown at the top of the X-axis as a zero level. All other values of the graph are displayed relative to that peak. This is especially useful for FFT measurements, since it is easy to measure the level of harmonics and other signals relative to the carrier peak, regardless of the signal level.
Spacing
Swept measurements are done by measuring a series of points. These points may be spaced either linearly (equally-spaced across the frequency range), or logarithmically (spaced using a log function to match a logarithmic x-axis). The Spacing dropdown box can be set to Log or Linear, as required. Additionally, the number of measurement points is set using the Step Count field.
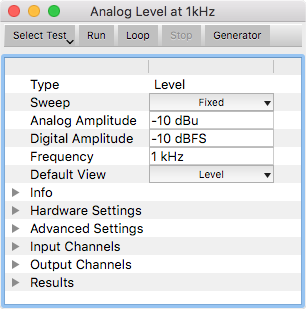
Level Test
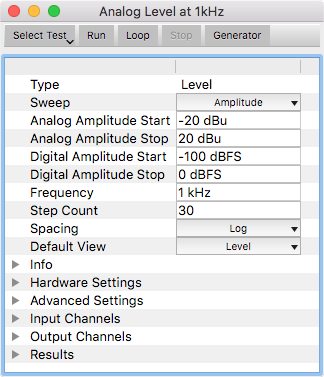
The Level test supports Sweep Fixed (single-frequency), Sweep Frequency, and Sweep Amplitude tests. Frequency, Analog Amplitude, and Digital Amplitude fields are available. Since both digital and analog measurements can be done at the same time, there are separate fields for the digital and analog generator level and units. The units specified in these two fields are also used as the units reported in the analyzer (input) measurements, regardless of whether a generator is used or not. Uncheck all of the Output Channels if no generator is required–the Frequency field should still be set to the nominal frequency of the incoming signal for best measurement accuracy, even if the generator is not used.
For analog measurements the level test returns the true RMS value over an integration period of at least 25 cycles. If the measurement is in units of voltage (V, mV, or uV), the test also returns the peak measurement, which is useful for calculating crest factor. For digital level, the results are peak measurements, measured over at least 25 cycles.
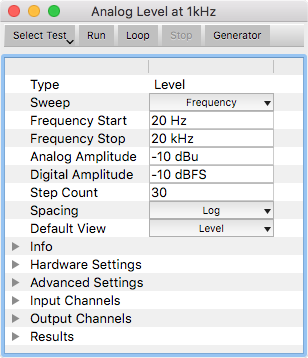
Sweep Frequency provides a frequency response plot between the Frequency Start and Frequency End values, with the generator level fixed at the specified level. There is a separate level available for digital and analog measurements; both domains may be measured simultaneously, and will appear on the same graph, but with two different y-axis. The number of steps and the measurement Spacing may be specified as well.
Sweep Amplitude provides an output level vs. input level test, which is useful for determining linearity or compression of a device. Separate analog and digital Amplitude Start and Amplitude End values allow simultaneous measurement of both domains. The results appear on the same graph, with separate axis for digital and analog values.
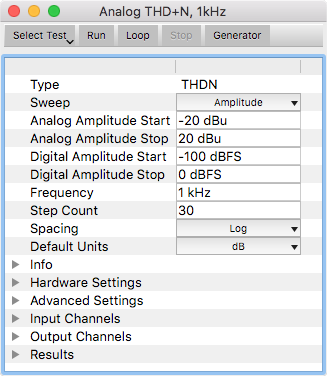
THD+N Test
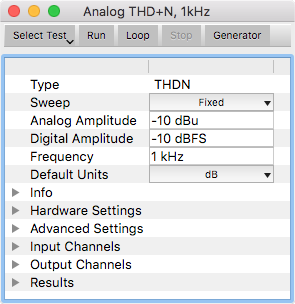
AverLAB implements the THD+N test using the basic algorithm outlined in the Audio Engineering Society standard AES17-1998 (revised 2009). In this algorithm, the RMS level of the fundamental signal, harmonics, and noise is calculated. Then a notch filter is used to remove the fundamental, leaving the harmonics and noise, and that RMS level is calculated. THD+N is the ratio of the harmonics and noise over the fundamental, harmonics and noise. This result is returned as percent or dB .
The center frequency of the notch filter is determined by the value entered in the Frequency field. Normally, this is the same as the generator frequency. However, when measuring external sources set the Frequency value of the external signal and uncheck all Output channels.
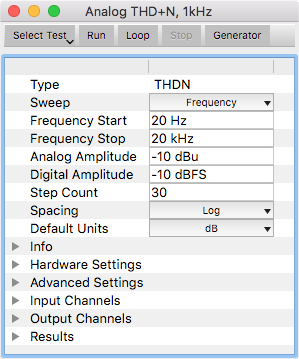
Sweep Frequency provides a THD+N vs. frequency plot between the Frequency Start and Frequency End values, with the analog and digital generator levels fixed at the specified values. There is a separate level available for digital and analog measurements; both domains may be measured simultaneously, and will appear on the same graph, but with two different y-axis. The number of steps and the measurement interval may be specified as well.
Swept measurements may be displayed as dB or as percent by changing the Display setting. Once a measurement is complete the graph may be switched between percent and dB using controls in the Results window.
Sweep Amplitude provides a THD+N vs. level test over the specified amplitude ranges. Separate analog and digital Amplitude Start and Amplitude End values allow simultaneous measurement of both domains. The results appear on the same graph, with separate axis for digital and analog values.
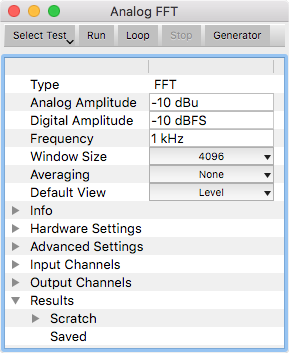
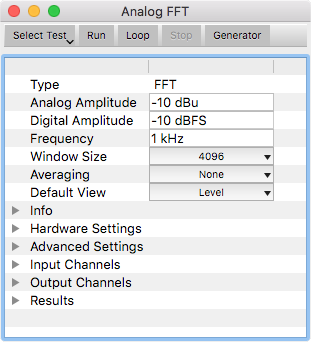
FFT Test
The FFT test shows an amplitude vs. frequency plot for the measured inputs. FFT stands for Fast Fourier Transform, which is a mathematical process to transform a series of discrete samples that are amplitude vs. time into an array of values corresponding to amplitude vs. frequency. The Window Size, which must be a power of 2, specifies both the number of samples needed and the number of frequency points (bins) that are returned by the FFT. The more bins there are the finer the frequency resolution of the plot, and the lower the residual noise floor of the measurement. At the same time, more bins requires more samples to be measures, and more calculations in the transform, all of which takes longer.
FFT algorithms generally pre-process the sample data using a type of filter called a Window Function. This is different from the Window Size parameter in the FFT dialog. A Window Function applies a weighting algorithm to the sample data that may reduce the spread of energy between bins, minimize amplitude errors, or optimize the data to best determine the precise frequency of one or more signals in the measurement. However, it is not possible to optimize all of these desirable results at the same time, so different windows are used depending on what is most important for a given measurement.
AverLAB supports many different window functions, however only the default window is currently available. The Rife-Vincent window function that is the default setting for the FFT provides very good amplitude accuracy, moderate frequency spread across bins, and excellent off-carrier noise performance, allowing low-level signals to be easily resolved and measured in the presence of much higher carrier signals. Rife-Vincent provides excellent overall results for a general-use FFT.
Digital and analog generators may be used in the FFT, and both digital and analog analyzers are able to make FFT measurements at the same time. Separate Analog Amplitude and Digital Amplitude settings are available, with a common Frequency setting. Analog Amplitude units (dBu, dBV, dBmv, dBuv, V, mV, uV) must be specified, and the y-axis for the graph will be in terms of the units specified for the generator amplitude, even if the generator is not used. Digital Amplitude must be specified in dBFS, and those traces on the graph will use a separate y-axis.
The Window Size specifies the number of frequency bins to use for the FFT. Values of 1024, 2048, 4096, 8192, 16384, and 32768 are available. Averaging is also available. This is a rolling average algorithm; the number specified of FFT measurements are averaged in a single measurement, with the graph updated in realtime for each measurement in the average. If the FFT is looping, only the specified number of measurements are shown in the resulting average, while earlier measurements are dropped from the average. For example, if Averaging is set to 4, then four FFT’s are averaged, and on the 5th measurement the first one is dropped from the averaged result. Averaging values of None, 2, 4, 8, 16, and 32 are available.
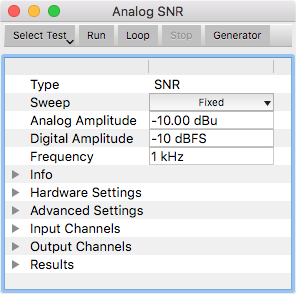
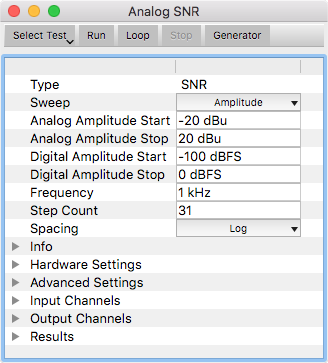
SNR Test
The Signal to Noise Ratio (SNR) test measures the difference between a signal being output from a device under test vs. the noise floor of the device with no signal. AverLAB implements this test by first turning the generator(s) on at the specified frequency and level and measuring the incoming level on the corresponding analyzer channel(s). It then turns all generators off and measures the noise with no signal. Subtracting the values (in dB) gives the measured SNR.
The SNR test supports Sweep Fixed (single-frequency), Sweep Frequency, and Sweep Amplitude tests. Separate Analog Amplitude and Digital Amplitude settings are available, with a common Frequency setting. Analog Amplitude units (dBu, dBV, dBmv, dBuv, V, mV, uV) must be specified, while Digital Amplitude units must be in dBFS. Either digital or analog output channels must be selected for every active channel in the test.
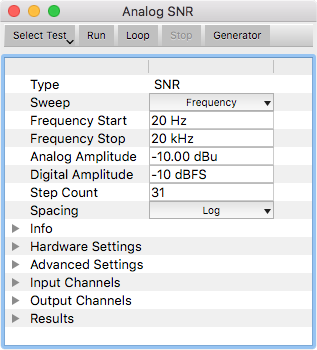
Sweep Frequency provides an SNR vs. frequency plot between the Frequency Start and Frequency End values, with the generator level at the specified level. There is a separate level available for digital and analog measurements; both domains may be measured simultaneously, and will appear on the same graph, but with two different y-axis.
Sweep Amplitude provides an SNR vs. level test. Separate analog and digital Amplitude Start and Amplitude End values allow simultaneous measurement of both domains. The results appear on the same graph, with separate axis for digital and analog values.
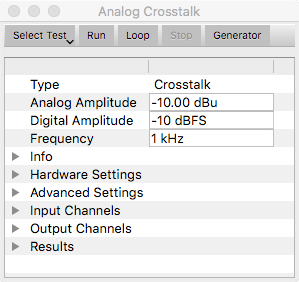
Crosstalk Test
The AverLAB crosstalk test measures the residual signal and noise on each input channel with each of the output channels turn on one at a time. This is similar to an SNR test, but the measurements are between different channels instead of a simple generator on/off level measurement. This can be done across any number of channels and across both digital and analog domains, if desired.
The test turns on the generator for the first specified output channel at the specified amplitude and frequency. It then measures all the input channels at once. The loudest input channel becomes the “signal level” for the later crosstalk calculation. The residual noise measurements for the other input channels are saved as the “noise level” for each of those channels. This process is repeated for each of the output channels. The resulting crosstalk is then calculated as the signal level (in dB) minus the noise level (in dB) for each of the channels other than the one designated as the “signal level” input channel. Therefore, crosstalk is reported for each channel other than the one driven by the generator, across each of the generator output channels.
This algorithm allow crosstalk to be quickly measured on multichannel devices without knowing the routing of the device under test. Many devices are not routed one to one, where the first input corresponds to the first output, the second input to the second output, and so on. Simply select the input and output channels on AverLAB, and the results will cover all possible combinations.
Separate Analog Amplitude and Digital Amplitude settings are available, with a common Frequency setting. Analog Amplitude units (dBu, dBV, dBmv, dBuv, V, mV, uV) must be specified for the generator, while the Digital Amplitude must be in units of dBFS.